Data Science
Data Science — including machine learning, data analysis, and data visualization
First of all, let’s review what machine learning is.
I think the best way to explain what machine learning is would be to give you a simple example.
Let’s say you want to develop a program that automatically detects what’s in a picture.
So, given this picture below (Picture 1), you want your program to recognize that it’s a dog.

Given this other one below (Picture 2), you want your program to recognize that it’s a table.

You
might say, well, I can just write some code to do that. For example,
maybe if there are a lot of light brown pixels in the picture, then we
can say that it’s a dog.
Or
maybe, you can figure out how to detect edges in a picture. Then, you
might say, if there are many straight edges, then it’s a table.
However,
this kind of approach gets tricky pretty quickly. What if there’s a
white dog in the picture with no brown hair? What if the picture shows
only the round parts of the table?
This is where machine learning comes in.
Machine learning typically implements an algorithm that automatically detects a pattern in the given input.
You
can give, say, 1,000 pictures of a dog and 1,000 pictures of a table to
a machine learning algorithm. Then, it will learn the difference
between a dog and a table. When you give it a new picture of either a
dog or a table, it will be able to recognize which one it is.
I
think this is somewhat similar to how a baby learns new things. How
does a baby learn that one thing looks like a dog and another a table?
Probably from a bunch of examples.
You probably don’t explicitly tell a baby, “If something is furry and has light brown hair, then it’s probably a dog.”
You would probably just say, “That’s a dog. This is also a dog. And this one is a table. That one is also a table.”
Machine learning algorithms work much the same way.
You can apply the same idea to:
- recommendation systems (think YouTube, Amazon, and Netflix)
- face recognition
- voice recognition
among other applications.
Popular machine learning algorithms you might have heard about include:
- Neural networks
- Deep learning
- Support vector machines
- Random forest
You can use any of the above algorithms to solve the picture-labeling problem I explained earlier.
Python for machine learning
There are popular machine learning libraries and frameworks for Python.
Two of the most popular ones are scikit-learn and TensorFlow.
- scikit-learn comes with some of the more popular machine learning algorithms built-in. I mentioned some of them above.
- TensorFlow is more of a low-level library that allows you to build custom machine learning algorithms. It is mostly used with Keras(another library).
If
you’re just getting started with a machine learning project, I would
recommend that you first start with scikit-learn. If you start running
into efficiency issues, then you can start looking into TensorFlow.
How should I learn machine learning?
To learn machine learning fundamentals, I would recommend either Stanford’s or Caltech’s machine learning course.
- Please note that you need basic knowledge of calculus and linear algebra to understand some of the materials in those courses.
Then, you can practice what you’ve learned from one of those courses with Kaggle.
It’s a website where people compete to build the best machine learning
algorithm for a given problem. They have nice tutorials for beginners,
too.
What about data analysis and data visualization?
To help you understand what these might look like, let me give you a simple example here.
Let’s say you’re working for a company that sells some products online.
Then, as a data analyst, you might draw a bar graph like this.
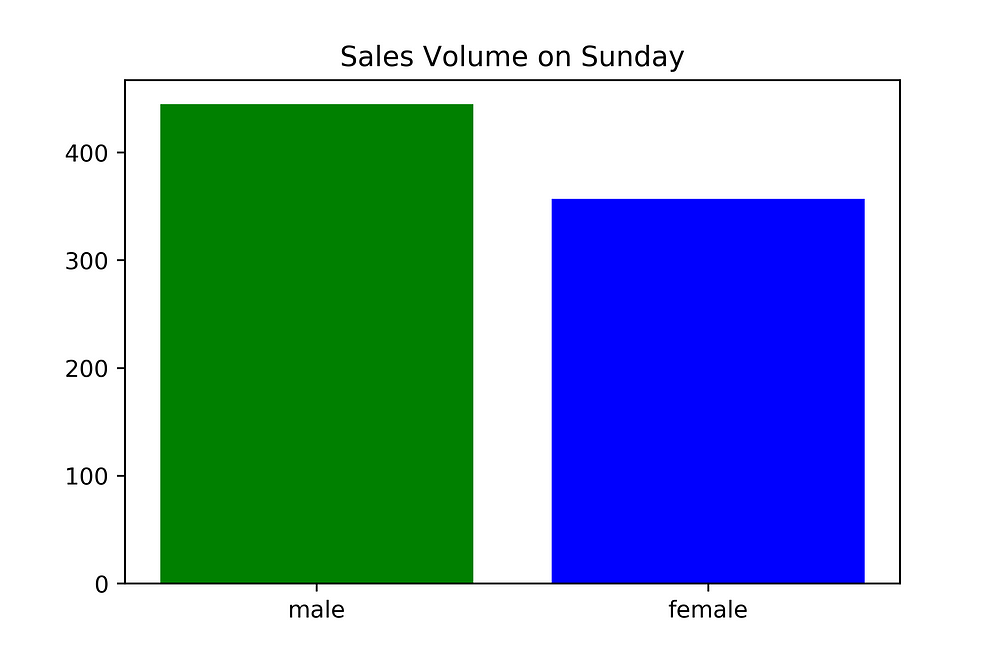
From
this graph, we can tell that men bought over 400 units of this product
and women bought about 350 units of this product this particular Sunday.
As a data analyst, you might come up with a few possible explanations for this difference.
One
obvious possible explanation is that this product is more popular with
men than with women. Another possible explanation might be that the
sample size is too small and this difference was caused just by chance.
And yet another possible explanation might be that men tend to buy this
product more only on Sunday for some reason.
To understand which of these explanations is correct, you might draw another graph like this one.
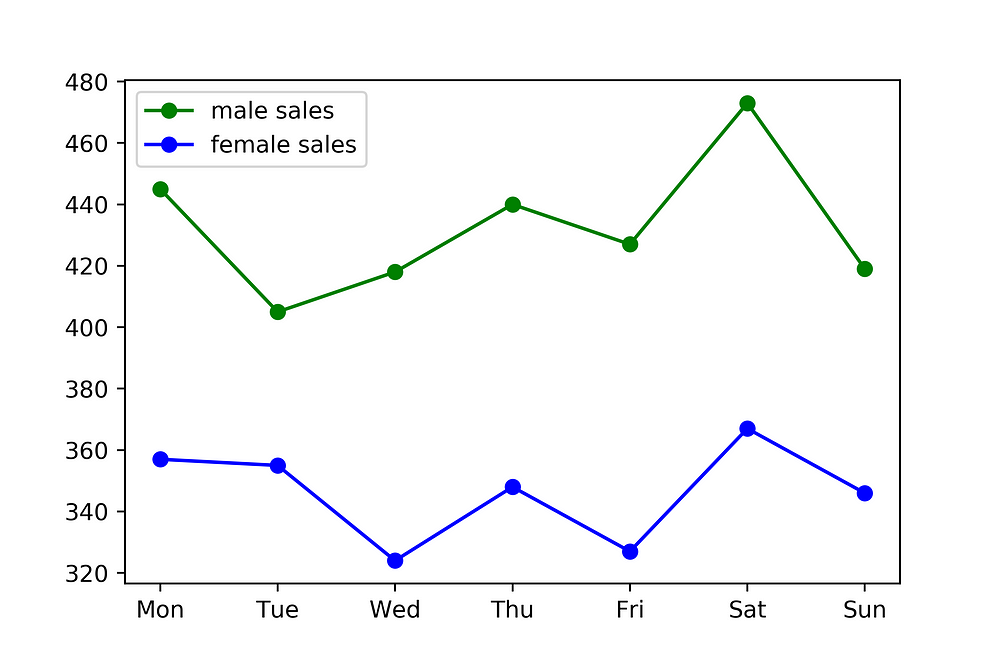
Instead
of showing the data for Sunday only, we’re looking at the data for a
full week. As you can see, from this graph, we can see that this
difference is pretty consistent over different days.
From
this little analysis, you might conclude that the most convincing
explanation for this difference is that this product is simply more
popular with men than with women.
On the other hand, what if you see a graph like this one instead?
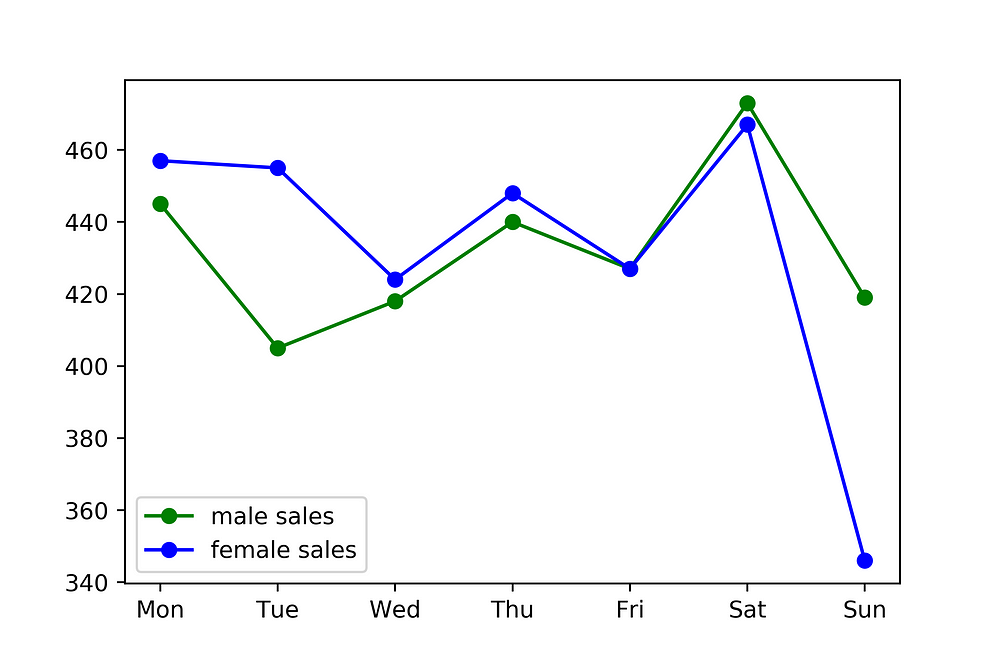
Then, what explains the difference on Sunday?
You
might say, perhaps men tend to buy more of this product only on Sunday
for some reason. Or, perhaps it was just a coincidence that men bought
more of it on Sunday.
So, this is a simplified example of what data analysis might look like in the real world.
You need to use SQL to pull data from databases.
Then, you can use either (Python + Matplotlib) or (JavaScript
+ D3.js) to visualize and analyze this data.
Data analysis / visualization with Python
One of the most popular libraries for data visualization is Matplotlib.
It’s a good library to get started with because some other libraries such as seaborn are based on it. So, learning Matplotlib will help you learn these other libraries later on.
Nice Post..
ReplyDeleteThanks for sharing..
Keep up the good work..
Microsoft Power BI Training
Power BI is Different From Other BI Tools
Tired of your current job? Time to learn Power BI
Tableau or Power BI?
Are Power BI skills in demand?
Nice post, Thanks for sharing much appreciated for commenting. Keep posting like this.
ReplyDeleteMicrosoft Power BI Training
Online Power BI Course
Learn Power BI